Big Data Analytics: How Front Offices Use Data
Behind every modern NBA front office sits a data infrastructure that would look familiar to any computer science graduate: distributed databases, ETL pipelines, dashboards, and predictive models, all built to answer questions that ultimately come down to a handful of consequential decisions — who to draft, who to sign, who to play, and when. This article summarizes a department seminar and follow-on group project exploring how data engineering and analytics practices, the same ones taught in our database and systems courses, translate directly into professional sports operations.
The seminar grew out of a simple observation: students were already fluent in the sport as fans, tracking trades and following advanced stats on their own time, but had never thought of a front office as fundamentally a data organization. Reframing it that way turned out to be a remarkably effective way to make abstract systems concepts — schema design, pipeline latency, data governance — feel immediately relevant rather than theoretical.
Teams as Data Organizations
The session opened by mapping the flow of information a modern franchise deals with: play-by-play event feeds arriving during live games, player-tracking coordinates generated many times per second, medical and biometric data from wearables, scouting reports written in free text, video footage, and traditional box-score statistics. Each of these sources has a different shape, a different update frequency, and different reliability guarantees — which makes the underlying data infrastructure a genuinely interesting systems design problem, not just a storage exercise.
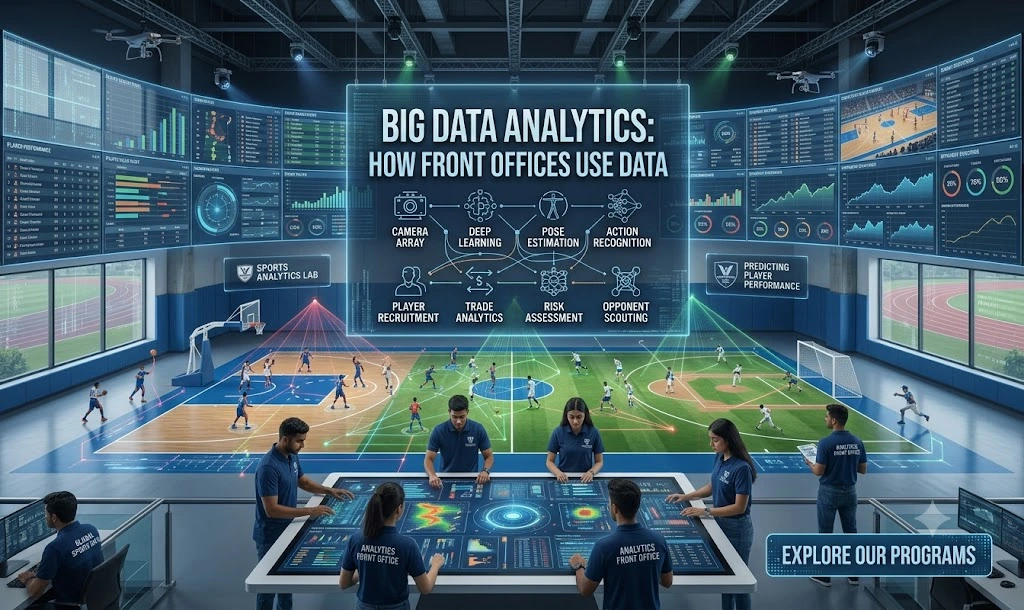
Students discussed how such an organization might structure its pipeline: a fast ingestion layer for time-sensitive, in-game data; a slower batch layer for historical and video-derived data; a central warehouse where cleaned and joined data lives; and a semantic layer on top that lets analysts and coaches query information without needing to understand the underlying schema. This layered structure closely mirrors the lambda-architecture pattern covered in the department's distributed systems course, and connecting the two gave the pattern a concreteness that lecture examples sometimes lack.

Figure 1:
From Raw Events to a Decision
A large part of the discussion focused on the distance between raw data and an actual decision a coach or executive can act on. A raw event feed might record that a shot was taken from a specific coordinate with a specific defender nearby; turning that into something useful — a shot-quality model, a defensive matchup recommendation, a lineup efficiency rating — requires several layers of transformation, each of which needs to be validated, versioned, and explainable to people who did not write the code.
This is where the seminar spent real time on dashboard and interface design, a topic students sometimes underweight relative to modeling. A beautifully engineered model that produces a number nobody trusts or understands is not useful to a coaching staff making decisions in the middle of a game. The class examined design principles for presenting uncertainty honestly, avoiding false precision, and prioritizing the two or three numbers that actually change a decision over a wall of statistics that looks impressive but adds noise.
"We spent almost as much time discussing how to present a number as how to compute it. That was the biggest surprise of the seminar — the modeling is often the easy part compared to building something a coach will actually trust in real time."
— Akshita Sharma (MCA Student),
Data Governance in a Sports Context
The seminar also devoted a full session to governance and privacy — topics students associate more readily with healthcare or finance than with sports, but which turn out to be just as relevant. Player biometric and medical data carries real sensitivity and, in many jurisdictions, real regulatory obligations. Even seemingly innocuous data, like granular tracking coordinates, raises questions about consent, ownership, and appropriate use once it is combined with other sources in ways an individual player never explicitly agreed to.
Students worked through a short case discussion on how a hypothetical analytics department might set access controls — who can see raw biometric data versus aggregated summaries, how long different data categories should be retained, and how audit logging can maintain accountability without slowing down day-to-day analysis. The exercise mapped directly onto access-control and data-governance concepts from the department's database security unit, again reinforcing how directly transferable these skills are.
The Group Project
Following the seminar, students formed small groups and built a mock analytics dashboard answering a front-office question of their own choosing. Topics ranged from lineup-efficiency exploration to a simplified draft-value model to a scouting-report search tool that let users query free-text reports by keyword and sentiment. Each group had to design a schema, build a small ETL process to populate it from a provided sample dataset, and produce an interactive dashboard aimed at a specific, named user persona — for instance, 'a head coach deciding on second-half substitution patterns,' rather than a generic audience.
"Designing for a specific persona changed everything about how students approached the problem. Once you're building for a coach with ninety seconds during a timeout rather than an analyst with an afternoon, your priorities shift completely — and that's exactly the kind of design thinking we want students carrying into any systems role."
— [Mr. Narayan Vyas, Assistant Professor], Department of Computer Science & Applications
Presentations at the end of the project were evaluated not just on technical correctness but on whether a non-technical stakeholder could actually use the tool to make a faster or better decision — a rubric that pushed several groups to simplify dashboards they had over-engineered in earlier drafts, itself a valuable lesson in resisting feature creep.
Schema Design Trade-offs
One of the more subtle lessons emerged from schema design itself. Several groups initially built a single wide table joining player, game, and shot-level data, which was simple to query but slow to update and prone to inconsistency whenever new data arrived. Refactoring toward a properly normalized schema, with clear fact and dimension tables, sped up their ETL process considerably and made it far easier to add a new data source later without restructuring everything already built — a direct, hands-on encounter with normalization trade-offs that many students had previously only seen in textbook diagrams.
This exercise also introduced students to the practical reality that schema decisions are rarely permanent. Two groups had to migrate their schema mid-project after realizing their original design could not cleanly represent a player who changed teams mid-season — a small but realistic example of the kind of evolving-data problem that real sports databases handle constantly, and one that pushed several students to build in versioning and change-tracking rather than assuming a static structure.
Communicating Results to a Non-Technical Audience
As a closing exercise, each group presented their dashboard twice: once to classmates with a technical background, and once in a mock presentation framed as if pitching the tool to a general manager with no interest in implementation details. The second presentation proved far more difficult for most groups, who had to strip away jargon, lead with the decision the tool supported rather than the technology behind it, and anticipate skeptical questions about how much to trust a number generated by a model rather than direct observation.
That exercise mirrored a genuine tension in professional analytics work: technical rigor and persuasive communication are both necessary, and neither compensates for a deficiency in the other. Several students noted afterward that the communication exercise was, unexpectedly, the part of the project they found most transferable to internships and future job interviews.
One group even built two versions of the same dashboard side by side for their presentation — a dense, metric-heavy version and a simplified three-number version — specifically to make the contrast visible to classmates who had not yet internalized how differently technical and non-technical audiences consume the same underlying analysis. That side-by-side comparison became something of an informal teaching aid for the rest of the cohort.
Looking Ahead
Feedback from the seminar has already shaped plans for next semester, including a proposed unit on real-time stream processing using a simulated live play-by-play feed, and a closer collaboration with the machine learning module on player performance prediction so that the dashboard and modeling tracks reinforce each other end to end. There is also interest in inviting a guest practitioner from the sports analytics industry to speak candidly about the gap between classroom pipelines and production systems that must run reliably during nationally televised games.
More broadly, the seminar reinforced a point the department returns to often: the fundamentals of good data engineering — clean schemas, honest uncertainty, thoughtful governance, and design centered on the actual user — do not change much from domain to domain. Basketball simply gave students a subject they were already motivated to think carefully about.
About the authors: [Mr. Narayan Vyas, Assistant Professor] teaches the department's database systems and data engineering coursework. [Akshita Sharma (MCA Student)] is a student who led the draft-value modeling group during this project.